K-Nearest Neighbors (K-NN) Algorithm
Implementation and Analysis
Overview
This project is about building a k-Nearest Neighbors (k-NN) classifier from scratch using Python. The k-NN algorithm is a simple machine learning method used for classification tasks. Instead of learning a mathematical model, it memorizes the training data and makes predictions by looking at the k closest data points.
How It Works:
- The algorithm calculates the distance between a new data point and all training examples.
- It selects the k nearest neighbors (most similar examples).
- The class (label) with the most votes among these neighbors is assigned to the new data point.
Implementation
K-Nearest Neighbors (K-NN) is a simple method for classification. It works by comparing new data points with existing ones and classifying them based on similarity. The main steps include:
- Distance Calculation: The algorithm measures how close data points are using Euclidean or Manhattan distance.
- Fit Method: This step stores the training data for later use.
- Predict Method: It finds the
k-nearest points to the new data and assigns the most common class. - Score Method: This calculates how well the model performs by checking its accuracy.
Data Preparation and Preprocessing
Before using K-NN, the data needs to be prepared. The dataset includes:
- Training Inputs:
X_train(features of training samples) - Training Labels:
y_train(correct class for training samples) - Test Inputs:
X_test(features of test samples) - Test Labels:
y_test(correct class for test samples)
To make sure all features contribute equally, the StandardScaler from Scikit-learn is used to
scale
them.
Testing

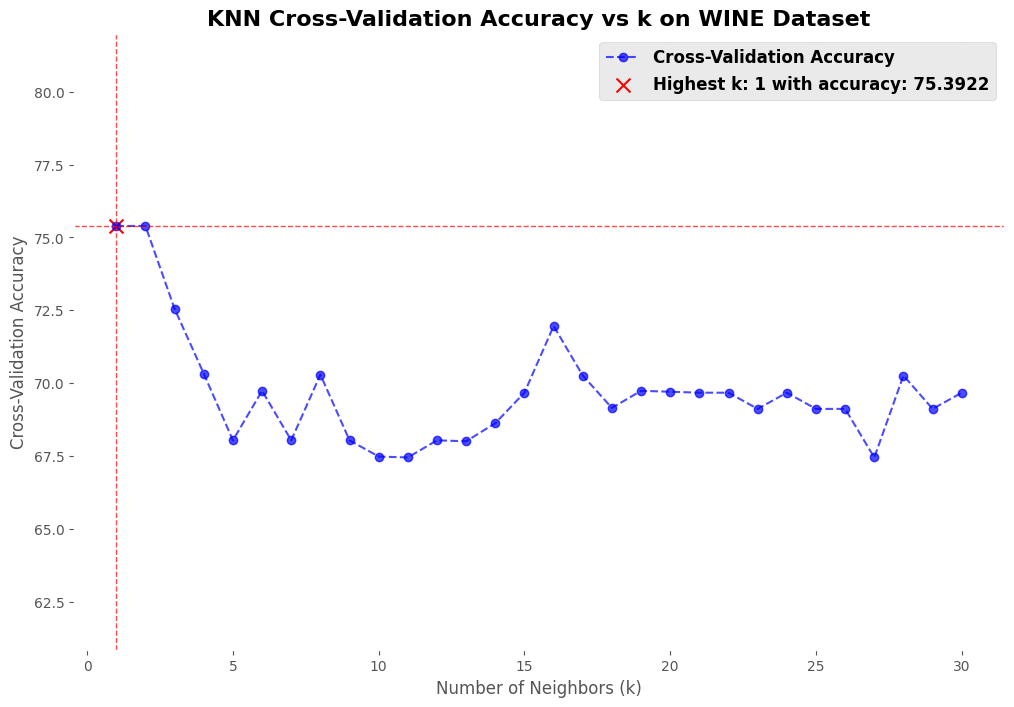
The testing was performed using K-Fold Cross Validation, where the dataset (X,y) was divided into 10 equal parts (folds). The model was trained on 9 of these parts and tested on the remaining part. This process was repeated 10 times, ensuring that each part of the data served as a test set once. To determine the optimal hyperparameter, different values of K (ranging from 1 to 30) were tested for the K-Nearest Neighbors (KNN) model. For each value of K, the model’s accuracy was computed across all folds, and the average accuracy was recorded. The best value of K was identified as the one that yielded the highest average accuracy. The results were stored in two lists: one containing the tested K K values and the other containing their corresponding average accuracies. These results helped in selecting the most effective KNN model for the dataset.
Performance Analysis
The results below were obtained by testing the K-Nearest Neighbors (KNN) algorithm on a modified version of the MNIST dataset. This dataset includes only images of the digits 5 and 6. The test aimed to evaluate how well KNN can classify these two digits
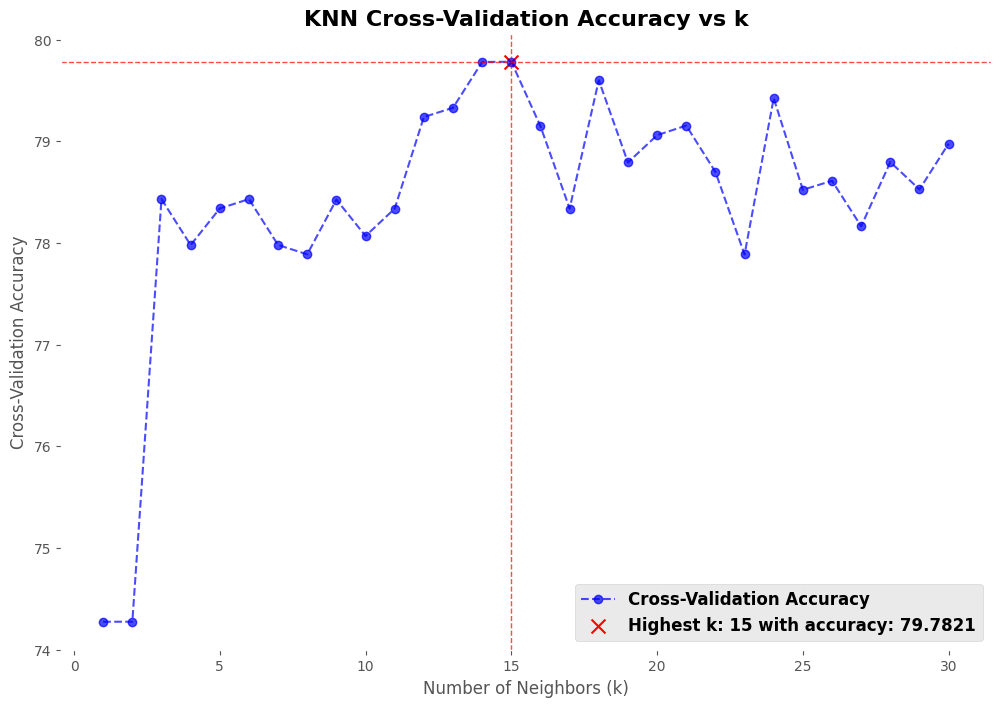
The accuracy of K-NN depends on the choice of k:
- Small k Values: The model performs poorly at
k = 1andk = 2with 74.25% accuracy. Smallkmakes the model sensitive to noise. - Moderate k Values: When
kis3or4, accuracy improves to 78.5%, as the effect of noise reduces. - Large k Values: The accuracy peaks at
k = 15with 79.51%. However, increasingktoo much causes loss of detail and higher computation time.
Additional Tests
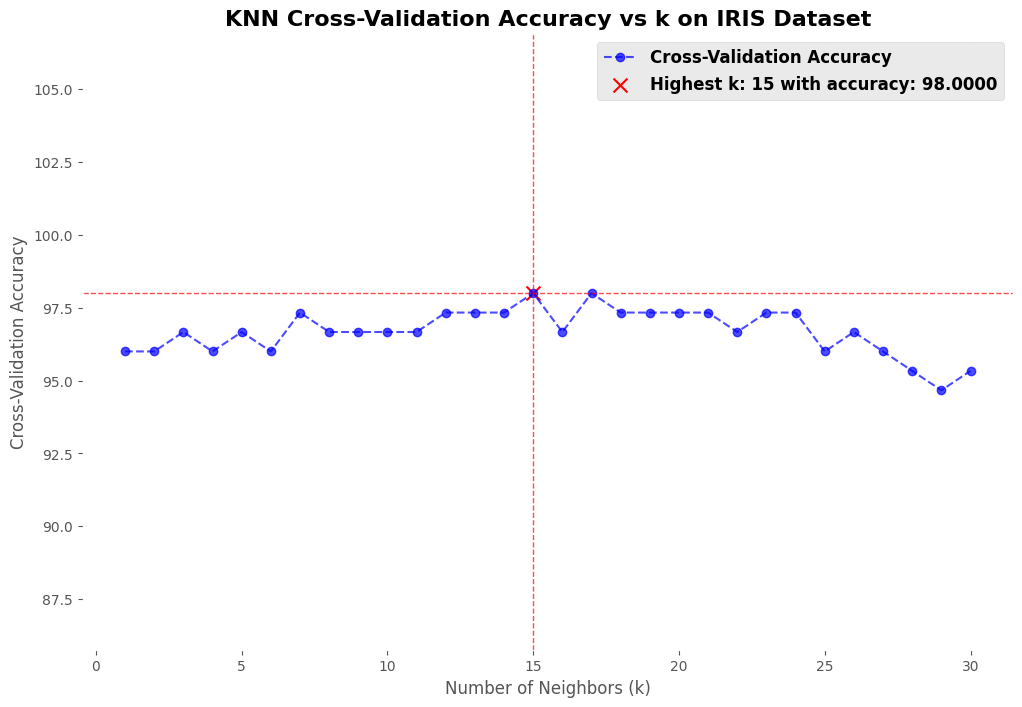
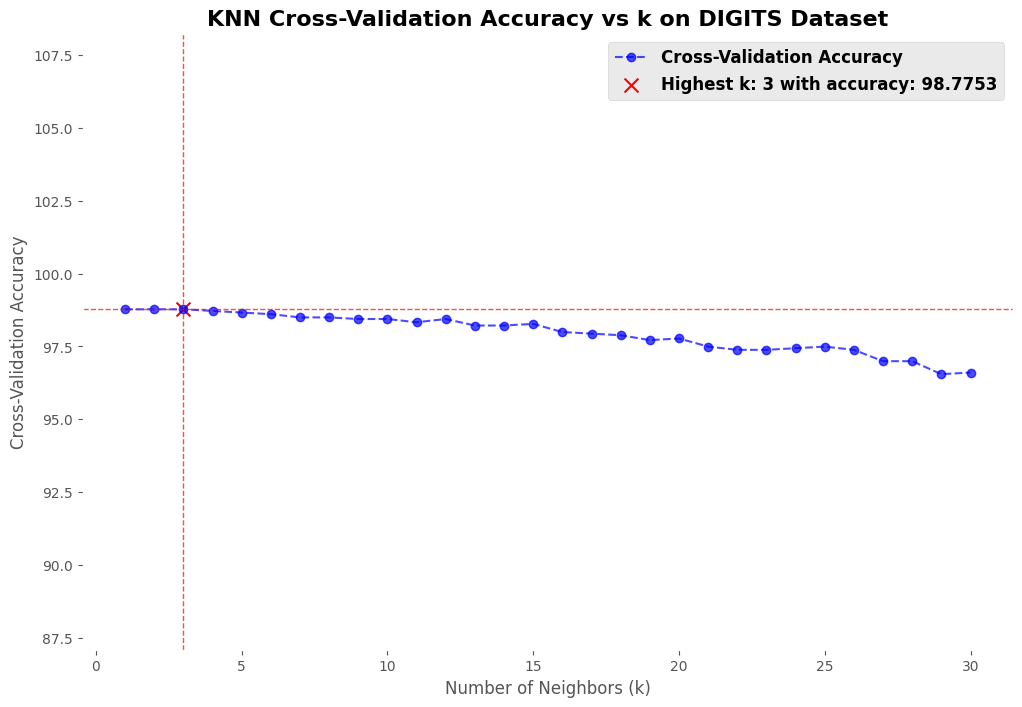
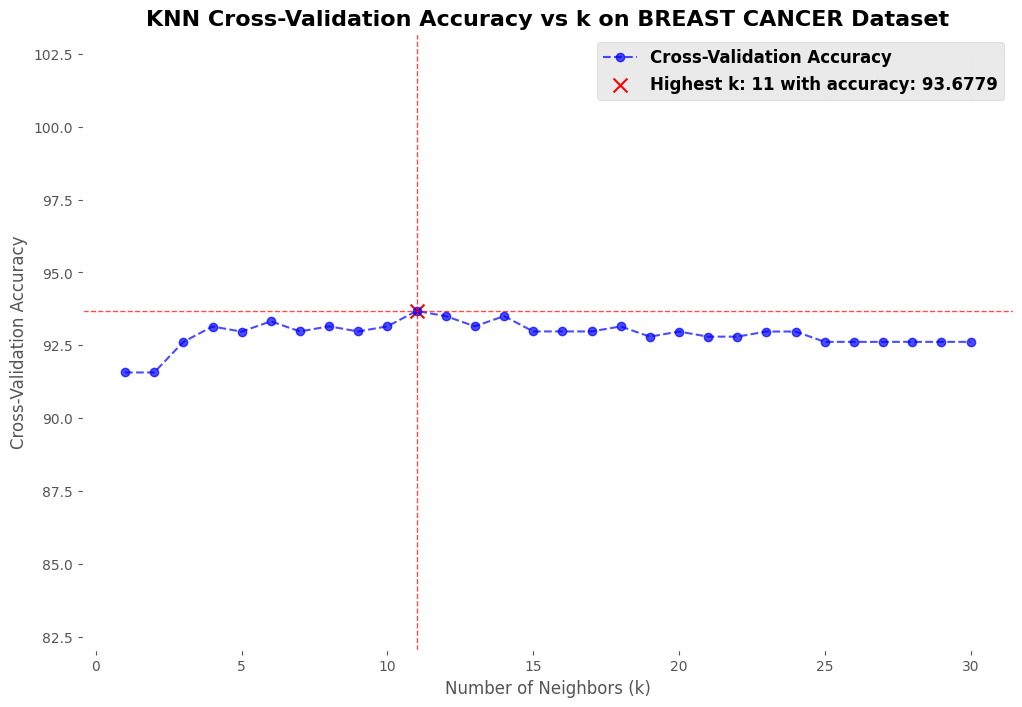
To further evaluate the performance of K-NN, additional tests were conducted using various datasets from Scikit-learn:
- Iris Dataset: A well-known dataset for classification.
- Digits Dataset: Handwritten digit recognition.
- Wine Dataset: Classification of different wine types.
- Breast Cancer Dataset: Medical diagnosis of breast cancer.
- Diabetes Dataset: Predicting diabetes progression.
- California Housing Dataset: Regression task for housing prices.
Conclusion
The K-NN algorithm is effective for classification. Choosing the right k is key to its
performance.